Monday, July 26, 2010
Economic Policy Book Recommendation
Friday, July 23, 2010
Origin of 'Dynamic Programming'
An interesting question is, ‘Where did the name, dynamic programming, come from?’ The 1950s were not good years for mathematical research. We had a very interesting gentleman in Washington named Wilson. He was Secretary of Defense, and he actually had a pathological fear and hatred of the word, research. I’m not using the term lightly; I’m using it precisely. His face would suffuse, he would turn red, and he would get violent if people used the term, research, in his presence. You can imagine how he felt, then, about the term, mathematical. The RAND Corporation was employed by the Air Force, and the Air Force had Wilson as its boss, essentially. Hence, I felt I had to do something to shield Wilson and the Air Force from the fact that I was really doing mathematics inside the RAND Corporation. What title, what name, could I choose? In the first place I was interested in planning, in decision making, in thinking. But planning, is not a good word for various reasons. I decided therefore to use the word, ‘programming.’ I wanted to get across the idea that this was dynamic, this was multistage, this was time-varying—I thought, let’s kill two birds with one stone. Let’s take a word that has an absolutely precise meaning, namely dynamic, in the classical physical sense. It also has a very interesting property as an adjective, and that is it’s impossible to use the word, dynamic, in a pejorative sense. Try thinking of some combination that will possibly give it a pejorative meaning. It’s impossible. Thus, I thought dynamic programming was a good name. It was something not even a Congressman could object to. So I used it as an umbrella for my activities (p. 159).
via Core Economics
Related;
Hamilton-Jacobi-Bellman Equation
Tuesday, July 13, 2010
Albania - V Shaped Recovery ahead

IMF Article IV Staff Report on Albania is released;
Outlook: The baseline is for a V-shaped recovery, albeit to a lower potential growth than before the crisis, with low inflation and external imbalances narrowing. However, downside risks are significant
and elevated budget financing requirements under unchanged policies will crowd out private investment,thereby undermining potential growth over the medium term.
Policy Discussions: A tighter fiscal stance with improvements in productivity and competitiveness is a superior adjustment strategy, and consolidation could serve to enhance, rather than damage, growth
prospects. The authorities’ fiscal adjustment strategy is based on over-optimistic revenue and growth expectations. There was agreement of the benefits of a clear, credible, and monitorable fiscal rule to safeguard fiscal sustainability. Monetary policy should remain cautious and supervisors remain vigilant, given heightened regional uncertainty. Improvements in the business environment are critical to harvest the benefits from closer EU integration.
Links on Albanian data:
Ministry of Finance
Bank of Albania
Ministry of Economy, Trade and Energy
Institute of Statistics
Monday, July 12, 2010
Lithuania's Adjustment


Average gross earnings have fallen by 12.4 percent from pre-crisis peaks, but in sectors such as construction and real estate services, labor costs are down 20–25 percent. Unemployment had reached 18.1 percent by end Q1 2010, with high levels of youth and long-term unemployment an increasing concern....
Restoring fiscal sustainability and ensuring financial stability are the
authorities’ key economic objectives. This supports the long standing currency board arrangement (CBA) and conditions for successful Euro adoption. The latter, would allow an orderly exit from the CBA, eliminate currency risks and reduce liquidity risk, a consideration
given the high degree of euroization (over 70 percent of bank assets but just one-third of deposits). Realizing the ambitious 2014 timeline for euro adoption will require addressing three key challenges: putting the public finances back on a sustainable footing, safeguarding
the health of the financial system, and rebalancing the economy towards tradables to fostermore balanced growth and job creation.
Related:
From Lithuania, a View of Austerity’s Costs
Burden-sharing in Lithuania
Bad Journalism At The Economist
Friday, July 9, 2010
Economic Literacy with Cartoons
One way being tried to improve economic literacy in Poland;
Related:
Civil Development Forum
Polish Central Bank's Economic Education Portel;
Last year, for instance, the "inflation" prize went to a three-page comic strip about a king who was so prodigal when it came to reimbursing dragon-slayers for their services with his daughters' hand in marriage that soon an apple would set you back twelve and a half units of royal female progeny.Presenting economic principles in quirky comic form has clearly struck a chord, especially with children who adore the genre. Economists the world over bemoan their compatriots' dismal grasp of the dismal science. Implemented on a large scale, FOR's idea could help fix that.

Related:
Civil Development Forum
Polish Central Bank's Economic Education Portel;
* Distance learning - comprehensive multimedia e-learning courses, accompanied by illustrations, animation clips, and films.
* Teacher's Centre - a service designed for teachers of economics or economics-related subjects at lower and upper secondary schools in Poland. It contains teaching aids in the form of ready-to-use lesson plans, and practical tips on efficient and unconventional methods of conducting lessons.
* Fun - numerous decision-making quizzes, skill-enhancing and strategic games, crossword puzzles, and jigsaws. This part of the portal has been created for those who want to acquire basic information on economics while having fun.
* Knowledge Mines - made of two parts: the Virtual Library, and the glossary of economic terms. The Virtual Library contains electronic versions of academic publications, including the Bank's publications, as well as publications by external institutions co-operating with NBPortal.pl. The glossary features over a thousand entries, explaining the meaning of economic terms.
* News - both business headlines and larger articles and papers, presenting current economic and business issues in an intelligible way.
Sunday, June 27, 2010


Friday, June 25, 2010
JEP is liberated
Journal of Economic Perspectives is now available to anyone on line, for free, going back to 1999
via Arnold Kling
Hal Varian's Ely Lecture
Computer Mediated Transactions
E-mail and other tools allow for asynchronous communication over a distance, which allows for optimization of tasks on a global basis. Knowledge work can be subdivided into tasks, much like the physical work in Adam Smith’s pin factory. But even more, those tasks can be exported around the world to where they
can most effectively be performed.
For example, consultants at McKinsey routinely send their PowerPoint slides to Bangalore for beautification. There are many other cognitive tasks of this sort that can be outsourced, including translation, proofreading, document research and so on. Amazon’s Mechanical Turk (Wikipedia 2009a) is an intriguing example of how computers can aid in matching up workers and tasks. As of March 2007 there were reportedly over 100,000 workers from 100 countries who were providing services via the Mechanical Turk (Pontin 2007)
Book Recommendation- Uncommon Sense

Gary S. Becker and Richard A. Posner
The Chapters will give you a flavor;
I. Sex and Population
1. The Sexual Revolution
2. Gay Marriage
3. Polygamy
4. Sex Selection
5. Immigration Reform
6. Putin’s Population Plan
II. Property Rights
7. Kelo and Eminent Domain
8. Pharmaceutical Patents
9. Grokster, File Sharing, and Contributory Infringement
10. Orphan Drugs, Intellectual Property, and Social Welfare
11. Organ Sales
12. Traffic Congestion
13. Privatizing Highways
III. Universities
14. Plagiarism
15. Tenure
16. For-Profit Colleges
17. Ranking Higher Education
IV. Incentives
18. Fat Tax
19. Trans Fats Ban
20. Libertarian Paternalism
21. Chicago and Big Boxes
V. Jobs and Employment
22. Judicial Term Limits
23. Economics of the Revolving Door
24. CEO Compensation
25. Income Inequality
26. Corporate Social Responsibility
VI. Environment and Disasters
27. Tsunami
28. Major Disasters
29. Federalism, Economics, and Katrina
30. Post-Catastrophe Price Gouging
31. Global Warming and Discount Rates
32. Efficient Water Conservation
VII. Crime and Punishment and Terrorism
33. Capital Punishment
34. Doping Athletes
35. Drunk Driving
36.Internet Gambling
37. Preventive War
38. Ethnic Profiling
39. Privatizing Security
40. Antiterrorism Allocations
41. Collective Punishment
VIII. The World
42. Economic and Political Freedom
43. Size of Countries
44. Hamas, Palestine, and Democracy
45. Google in China
46. Economics of National Culture
47. Microfinance and Development
48. World Inequality
49. Foreign Aid
Sunday, June 6, 2010
Assorted
Can a Soda Tax Save Us From Ourselves?
Pelé Remains the Last Word in a Changed World
How to commit the perfect crime
Impact Assessment Meets the Market
"Identity Economics" by George Akerlof and Rachel Kranton: A Rambling Review
High Stakes Innovation
Antibiotic Resistance, A Risk We Don't Worry About Enough
Anchoring
Podcasts
Menand on Psychiatry
We Don't Know How To Solve Global Poverty And That's A Good Thing
Speaker: Professor William Easterly.
Financial Crises And Crisis Economics: Past, Present And Future
Speaker: Professor Nouriel Roubini.
How Much Does Good Management Matter? Evidence From India
Speaker: Professor John Roberts.
The Plundered Planet
Speaker: Professor Paul Collier.
Building Social Business: The New Kind Of Capitalism That Serves Humanity's Most Pressing Needs
Speaker: Professor Muhammad Yunus
The Career-Family Conundrum
Speaker: Professor Claudia Goldin.
India's Economy: Performance And Challenges
Speaker: Shankar Acharya, Isher Ahluwalia, Montek Singh Ahluwalia, Surjit Bhalla, Martin Wolf.
Friday, May 21, 2010
What are binding constraints to growth in Fiji?
Is land reform the most binding constraint to growth in Fiji?
For Discussion: What do you think are the binding constraints to growth in Fiji?

Related:
Fisheries in the Economies of the Pacific Island Countries and Territories
Finding Balance-Making State-Owned Enterprises Work in Fiji, Samoa, and Tonga
IMF loan for Fiji seen as long-term liability
Doing Business - Fiji
WDI -Fiji
Binding Constraints in the Pacific
A comprehensive package of structural reforms is being prepared by the authorities to spur growth and create jobs. This includes reforms to the civil service, public enterprises, public pension fund, and land-lease system—together with price liberalization. Staff noted the importance of well designed reforms to lift potential growth...
Land tenure reform is a key priority of the Government’s reform agenda. It is also an area that Staff and other multilateral institutions also consider as vital to raising the economic growth potential of the economy given large areas of unutilized arable land. The Government has formed a task force that will facilitate utilization of idle land for productive use. Land will be available for leases under this effort from the first quarter of 2010.
For Discussion: What do you think are the binding constraints to growth in Fiji?

Related:
Fisheries in the Economies of the Pacific Island Countries and Territories
Finding Balance-Making State-Owned Enterprises Work in Fiji, Samoa, and Tonga
IMF loan for Fiji seen as long-term liability
Doing Business - Fiji
WDI -Fiji
Binding Constraints in the Pacific
Fiji Economy in Pictures
A recent review of the Fijian economy by IMF;


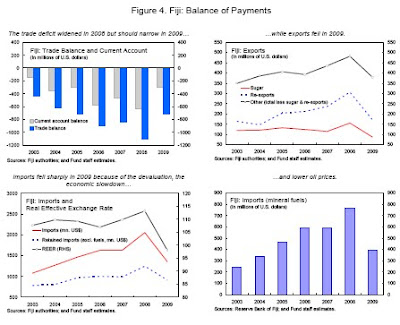


In Short: to boost growth do upfront fiscal adjustment including 'right sizing' the civil service.


In Short: to boost growth do upfront fiscal adjustment including 'right sizing' the civil service.
Wednesday, May 19, 2010
Sri Lanka - Quick and Dirty Growth Diagnostic?

From a recent economic update of Sri Lanka (World Bank);
Raising the long-term growth rate in Sri Lanka to 8 percent would require a comprehensive policy agenda. The government has committed itself to raising the long-term growth rate of the Sri Lankan economy. A standard growth-accounting framework illustrates how this can be achieved. Within this framework, growth can increase by any combination of: (i) accelerated human capital accumulation, either through increase labor force participation and employment or improvements in the quality of labor (more or better schooling); (ii) accelerated physical capital-accumulation through higher investments, or (iii) higher “total-factor-productivity” (TFP), which is the catch-all residual for structural improvements affecting the efficiency of use of human and physical capital. TFP improvements can happen in many ways (e.g., as a result of efficiency gains at the level of the individual business or factory or, e.g., as a result of sectoral shifts in the economy, from lower- to higher-productivity sectors, such as from agriculture to industry or services).
The scenario takes as starting point that growth will gradually accelerate to 8 percent by 2013—broadly in line with the Government’s medium term targets. It then asks, what are the requirements to the three underlying drivers of growth to achieve this target? It is clear that all factors—the input of labor, the level of investments, and the rate of overall productivity growth—would have to increase well beyond the levels of the past year. Specifically, the labor-force participation rate would have to gradually increase from its current level of around 49 percent, to 52-53 percent—equivalent to 500,000 jobs created in the next decade, over and above the number of jobs necessary to absorb the underlying population growth. In terms of capital accumulation, an increase in the ratio of investments-to-GDP from the current level of about 25 percent, to around 30 percent, would be required. Some of this increase may be financed by foreign direct investment (FDI), but it would also probably require an increase in national savings. Finally, TFP would have to increase to around 3 percent per annum—about 1 percentage point higher than its average level during the recent high-growth period from 2004-08, and well above its historical average since 1980
Related:
PREM Note 42: Measuring growth in total factor productivity
What use is sources-of-growth accounting?;
So here is a contest for economist (or wannabe economist) readers of this blog: can you come up with an interesting question to which a sources-of-growth decomposition is the answer?
Tuesday, May 18, 2010
How's Palau's economy doing?


IMF review's Palau's economy;
Directors supported the continued use of the U.S. dollar as legal tender, given Palau’s small size and administrative capacity. They observed that Palau has maintained its external competitiveness, but remains vulnerable to terms of trade shocks. Greater pass-through of global oil prices to contain debt accumulation in public utilities would therefore be desirable. Directors welcomed continued improvements in financial sector oversight, but urged caution in proceeding with the plans to launch a corporate and ship registry, which could pose new challenges in fighting money laundering given Palau’s current oversight capacity.
Directors noted that high-quality data are essential for policy formulation and surveillance. They looked forward to the adoption of the GDP numbers compiled with the help of the Pacific Financial Technical Assistance Center and to the increase in staffing levels at the Bureau of Budget and Planning.
Related:
Palau- data from WDI

Saturday, May 15, 2010
Tuesday, May 4, 2010
Assorted on Greece
Europe and IMF Agree €110 Billion Financing Plan With Greece
Prime Minister’s speech;
Huge National Debts Could Push Euro Zone into Bankruptcy
When did Greek economic policy turn bad?
Key Links for the Greek Financing Package
Prime Minister’s speech;
Our first concern was to regain credibility with our citizens. We have been honest from the very first moment with the Greek people.
Huge National Debts Could Push Euro Zone into Bankruptcy
When did Greek economic policy turn bad?
Key Links for the Greek Financing Package
Employment Cost Index- the most comprehensive measure of labor costs!

Employment Cost Index-
Compensation costs for civilian workers increased 0.6 percent, seasonally adjusted, for the 3-month period ending March 2010, the U.S. Bureau of Labor Statistics reported today. Wages and salaries (which make up about 70 percent of compensation costs) increased 0.4 percent while benefits (which make up the remaining 30 percent of compensation)--increased 1.1 percent
Table A. Major series of the Employment Cost Index (Percent change)
Table 6. Employment Cost Index for total compensation(1), for private industry workers, by bargaining status and census region and division
Related:
Public Sector Pay Outpaces Private Pay;
The chart shows that public and private sector pay rose in parallel from 2001 to 2004. Then the lines diverged. Since early 2005, public sector pay has risen by 5% in real terms. Meanwhile, private sector pay has been flat.
Saturday, May 1, 2010
Chart of the Day- G spot in the GDP

Stumbling and Mumbling has an interesting post;
There are three “headline” measures of government activity, which my chart shows.
One is the output of government services - health, defence, education etc - which shows up within the output measure of GDP.
Another is government consumption, which comes in the expenditure measure of GDP.
And a third is overall central government current spending, which is reported in table PSF3 of the public finances; in my chart, I’ve deflated this by the GDP deflator.
And here’s the queer thing. The correlation between annual changes in these three measures is low; no higher than 0.26 since 1984Q1.
How come? One reason is that central government spending includes debt interest and welfare payments, which the other two don’t.
Another reason is that government consumption includes spending on procurement which is excluded from output.
Related;
Public Service Output, Input and Productivity: Healthcare
Public Service Output, Input and Productivity: Education
Thoughts for your reflection- Cities and Economic Growth
“All throughout history, we’ve thought of heaven as the city on a hill. Done right, a city can be the pinnacle of human civilization. They’re the cathedrals of our era,”- Paul Romer
Related:
Global Prosperity Wonkcast;
Romer on Charter Cities
Paul Romer’s Bold New Idea for Charter Cities
Why Humanity Loves, and Needs, Cities;
A Tale of Many Cities
Cities Do It Better
Related:
Global Prosperity Wonkcast;
“…just because something is unfamiliar that doesn’t mean it’s inconceivable or it can’t happen…[T]hink more broadly [about] challenges that look intractable — poverty, the environment, green globalization, an urbanization wave of 3 billion people. If we open up our notion of what’s possible then these intractable problems look like real opportunities that could reshape the globe and change history.”
Romer on Charter Cities
Paul Romer’s Bold New Idea for Charter Cities
Why Humanity Loves, and Needs, Cities;
The figure shows the 25 percent correlation between the logarithms of population density and 2008 gross metropolitan product per capita (using 2000 Census population numbers). Per capita productivity increases by 4 percent as population density rises by 50 percent.
But why does productivity rise with density?
A Tale of Many Cities
Cities Do It Better
Saturday, April 24, 2010
Broadband and Growth

The World Bank has found that in low- and middle-income countries every 10 percentage point increase in broadband penetration accelerates economic growth by 1.38 percentage points—more than in high-income countries and more than for other telecommunications services (Figure 1).16 In a similar study, McKinsey & Company estimates that ―a 10 percent increase in broadband household penetration delivers a boost to a country‘s GDP that ranges from 0.1 percent to 1.4 percent. Booz & Company found that ―10 percent higher broadband penetration in a specific year is correlated to 1.5 percent greater labor productivity growth over the following five years.Booz also suggests that ―countries in the top tier of broadband penetration have exhibited 2 percent higher GDP growth than countries in the bottom tier. These studies are the latest in the already extensive work estimating broadband‘s economic impact.
Developing other elements of the broadband ecosystem also provides economic benefits. For example, the growth of Internet-related services and applications has created jobs and led to the creation of new businesses. For example, in November 2009 Google had a market capitalization of $168 billion and employed 19,000 people in 20 countries. China‘s leading Internet search engine, Baidu.com, has a market capitalization of more than $14 billion and over 6,000 employees, and in 2008 had revenues of $460 million.
Developers have also been extremely active in creating applications for various handsets. Annual sales of applications for Apple‘s iPhone exceed $2.4 billion, as well as stimulating additional hardware sales. Thus broadband creates significant economic opportunities for users, service providers, application developers, and network operators alike. McKinsey estimates that ―bringing broadband penetration levels in emerging markets to today‘s Western European levels could potentially add US$300–420 billion in GDP and generate 10–14 million jobs.
-Building broadband: Strategies and policies for the developing world
Friday, April 23, 2010
Development Indicator Watch- ICT

International Internet bandwidth (bits per person) -International Internet bandwidth is the contracted capacity of international connections between countries for transmitting Internet traffic.
Source: WDI
Impact on Growth: 'a 10 percentage point growth in broadband penetration can raise annual economic growth per person by up to 1.5 percentage points'
Related:
Measuring the Information Society 2010;
The latest edition of Measuring the Information Society features the new ITU ICT Development Index (IDI) and the ICT Price Basket - two benchmarking tools to measure the Information Society
World Telecommunication/ICT Development Report 2010;
The Report reviews the 10 targets, proposes concrete indicators to monitor them and makes recommendations on policies and measures to help achieve them:
# To connect villages with ICTs and establish community access points
# To connect universities, colleges, secondary schools, and primary schools with ICTs
# To connect scientific and research centers with ICTs
# To connect public libraries, cultural centers, museums, post offices, and archives with ICTs
# To connect health centers and hospitals with ICTs
# To connect all local and central Government departments and establish web sites and e-mail addresses
# To adapt all primary and secondary school curricula to meet the challenges of the information society, taking into account national circumstances
# To ensure that all of the world’s population has access to television and radio services
# To encourage the development of content and put in place technical conditions in order to facilitate the presence and use of all world languages on the Internet
# To ensure that more than half the world’s inhabitants have access to ICTs within their reach
Broadband plan for high speed internet sent to Congress
Internet penetration - who’s online? ;
The country with the highest number of broadband subscribers in absolute terms is the United States, with more than 81 million. However, another way to use the data is to look at broadband penetration – essentially the number of subscriptions per 100 inhabitants. Looked at from this perspective, the Netherlands is the OECD leader, with a broadband penetration rate of about 38%; at the other end of the scale is Mexico, with a rate of just over 6%. It’s worth noting that the number of broadband subscribers isn’t the same as the number of broadband users, which tends generally to be higher...In countries where households tend to be bigger, the number of subscribers may be correspondingly lower.
US The National Broadband Plan
The plan sets ambitious, but achievable goals, including 1-gigabit connections to every community; affordable, 100 megabits broadband to 100 million households; and raising adoption from 65% to 90% adoption, heading to 100%.
Does Lowering the Price of Broadband Increase Its Use?
Malaysia’s broadband plan – stimulating the private sector
DATA:
National ICT Data
ITU's ICT Eye
OECD telecommunication price baskets
Policy Advice:
Building broadband: Strategies and policies for the developing world-Given recent developments in the broadband market involving networks, services, applications, and users, and the experiences of leading markets—especially Korea—this report proposes that broadband be reconceptualized as an ecosystem rather than just high-speed connectivity. Using the ecosystem concept, the report discusses the characteristics of broadband strategies and identifies potentially useful policies and regulations.
*Source of the chart above, Malaysia Economic Update, Box 13,Developing Broadband in Malaysia
Wednesday, April 21, 2010
Country Economic Updates
Malaysia;
Philippines;
the Malaysian economy is projected to grow again at 4.1 percent in 2010, following a contraction of 2.3 percent in 2009.
The Malaysia Economic Monitor calls attention to four key policy thrusts to meet this challenge:
* Promoting further specialization of the economy
* Improving the skills base of the labor force
* Making growth more inclusive
* Bolstering public finances
Philippines;
Real GDP growth is projected to reach 3.5 percent in 2010 and 3.8 percent in 2011.Our analysis shows that, so far, the size and pace of the peak-to-trough and the projected recovery in 2010 is closely aligned with past recessions in the Philippines. However, unless reforms address long-standing growth bottlenecks, the recovery’s shape over the medium-term will move from V to \/¯¯ , i.e., stabilize at a lower equilibrium growth rate.
Saturday, April 17, 2010
Sunday Economic Indicator - I/S Ratio shows inventory replenishment
Coverage of an economic indicator every week- the idea borrowed from Sunday Function over at Built on Facts blog.

Definition: Inventories / Sales Ratios (Retail) - The inventories / sales ratios show the relationship of the end-of-month values of inventory to the monthly sales. These ratios can be looked at as indications of the number of months of inventory that are on hand in relation to the sales for a month. For example, a ratio of 2.5 would indicate that the retail stores have enough merchandise on hand to cover two and a half months of sales.
Latest Numbers: Inventories/Sales Ratio. The total business inventories/sales ratio based on seasonally adjusted data at the end of February was 1.27. The February 2009 ratio was 1.46.
Implications: 'this is the message of the inventory cycle, which appears to have largely run its course. Inventories surged as the recession intensified, leaving firms scrambling to bring output in line with the new level of sales. Now, firms have inventories under control'
More on the Implications:
Over at Macroblog more analysis;
From Bloomberg: The ratio of business inventories to sales was 1.25 in January, just above a 29-year low of 1.24 set in 2006 and down from a recession high of 1.46 in January 2009. The ratio averaged 1.3 in the last economic expansion, from 2001 to 2007.
Other tables released with the data;
Comments: Businesses generally prefer 1.45 months worth of goods. Though a lagging indicator, a window onto future orders and production activity. Remember GDP is calculated by adding all the sales in the economy plus change in inventories.
Related:
Manufacturing and Trade Inventory-to-Sales Ratio: Inventory Adjustment Over;
Inventories to Sales on Google Fast Flip
What We Don’t Know About the Economy

Definition: Inventories / Sales Ratios (Retail) - The inventories / sales ratios show the relationship of the end-of-month values of inventory to the monthly sales. These ratios can be looked at as indications of the number of months of inventory that are on hand in relation to the sales for a month. For example, a ratio of 2.5 would indicate that the retail stores have enough merchandise on hand to cover two and a half months of sales.
Latest Numbers: Inventories/Sales Ratio. The total business inventories/sales ratio based on seasonally adjusted data at the end of February was 1.27. The February 2009 ratio was 1.46.
Implications: 'this is the message of the inventory cycle, which appears to have largely run its course. Inventories surged as the recession intensified, leaving firms scrambling to bring output in line with the new level of sales. Now, firms have inventories under control'
More on the Implications:
Today's data is also encouraging because it shows that any business expansion we've seen in the first part of 2010 isn't outpacing consumer demand, with inventory levels remaining nearly flat. Considering how strong retail sales were in March, there's also reason to believe that inventories will fall during the month -- unless more hiring produced additional goods to compensate for the increased buying. Given the current balance of inventories and sales, there's little reason to believe U.S. businesses should engage in many more mass layoffs unless consumer demand unexpectedly weakens significantly.
Over at Macroblog more analysis;
I have been pondering those data as well, ever since the advance fourth quarter gross domestic product report indicated that 3.4 percentage points of the then-reported 5.9 percent annualized growth rate was accounted for by a slowing in the pace of inventory decumulation. (The numbers have subsequently been revised to 3.8 percentage points of a 5.6 percent growth rate.) It certainly appears that inventory-sales ratios have reverted to the prerecession norm, justifying Duy's sense that inventories will not be a big part of the economic story as we move through 2010.
That conclusion does rest, of course, on the likelihood that a downward trend in the ratio truly did break in the middle part of the decade. As the chart shows, the same pause in the trend occurred in the mid-1990s, only to commence its southward trek on the other side of the 2001 recession.
But the situation is even more curious than that. If you dig a little deeper, you find that not all inventory-sales ratios tell the same story. In particular, inventory-to-sales ratios at the retail level look very lean relative to prerecession levels while manufacturer's inventories still appear to be relatively bloated.
What, exactly, is that chart trying to tell us? Does it represent some shift in supply-chain management, with inventory holdings being pushed down from the retail level to manufacturers? If not, can we expect some resurgence in retail inventories (as the Duy-cited Bloomberg article suggests), coupled with continued decumulation at the manufacturing level? And what would be the net effect of such developments on aggregate inventory levels?
From Bloomberg: The ratio of business inventories to sales was 1.25 in January, just above a 29-year low of 1.24 set in 2006 and down from a recession high of 1.46 in January 2009. The ratio averaged 1.3 in the last economic expansion, from 2001 to 2007.
Other tables released with the data;
Table 1. Estimated Monthly Sales and Inventories for Manufacturers, Retailers, and Merchant Wholesalers
Table 2. Percent Changes for Sales and Inventories--Manufacturers, Retailers, and Merchant Wholesalers
Table 3. Estimated Monthly Retail Sales, Inventories, and Inventories/Sales Ratios, By Kind of Business
Comments: Businesses generally prefer 1.45 months worth of goods. Though a lagging indicator, a window onto future orders and production activity. Remember GDP is calculated by adding all the sales in the economy plus change in inventories.
Related:
Manufacturing and Trade Inventory-to-Sales Ratio: Inventory Adjustment Over;
inventory to sales ratio. This has declined sharply to 1.25 (SA) from the peak of 1.46 back in Dec 2008. This could decline further - the trend is definitely down over time - but clearly most of the inventory adjustment is over.
This is important because the change in inventory added significantly to Q4 GDP growth. (See BEA line 13: the contribution to GDP in Q4 from 'Change in private inventories' was 3.88 of the 5.9 percent annualized increase in GDP.)
Inventories to Sales on Google Fast Flip
What We Don’t Know About the Economy
Subscribe to:
Posts (Atom)


.png)