Friday, May 21, 2010

What are binding constraints to growth in Fiji?

Is land reform the most binding constraint to growth in Fiji?

A comprehensive package of structural reforms is being prepared by the authorities to spur growth and create jobs. This includes reforms to the civil service, public enterprises, public pension fund, and land-lease system—together with price liberalization. Staff noted the importance of well designed reforms to lift potential growth...

Land tenure reform is a key priority of the Government’s reform agenda. It is also an area that Staff and other multilateral institutions also consider as vital to raising the economic growth potential of the economy given large areas of unutilized arable land. The Government has formed a task force that will facilitate utilization of idle land for productive use. Land will be available for leases under this effort from the first quarter of 2010.


For Discussion: What do you think are the binding constraints to growth in Fiji?


Related:
Fisheries in the Economies of the Pacific Island Countries and Territories

Finding Balance-Making State-Owned Enterprises Work in Fiji, Samoa, and Tonga

IMF loan for Fiji seen as long-term liability

Doing Business - Fiji

WDI -Fiji

Binding Constraints in the Pacific

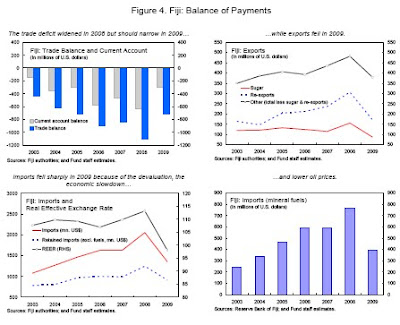
Fiji Economy in Pictures

A recent review of the Fijian economy by IMF;


In Short: to boost growth do upfront fiscal adjustment including 'right sizing' the civil service.

Wednesday, May 19, 2010

Sri Lanka - Quick and Dirty Growth Diagnostic?


From a recent economic update of Sri Lanka (World Bank);
Raising the long-term growth rate in Sri Lanka to 8 percent would require a comprehensive policy agenda. The government has committed itself to raising the long-term growth rate of the Sri Lankan economy. A standard growth-accounting framework illustrates how this can be achieved. Within this framework, growth can increase by any combination of: (i) accelerated human capital accumulation, either through increase labor force participation and employment or improvements in the quality of labor (more or better schooling); (ii) accelerated physical capital-accumulation through higher investments, or (iii) higher “total-factor-productivity” (TFP), which is the catch-all residual for structural improvements affecting the efficiency of use of human and physical capital. TFP improvements can happen in many ways (e.g., as a result of efficiency gains at the level of the individual business or factory or, e.g., as a result of sectoral shifts in the economy, from lower- to higher-productivity sectors, such as from agriculture to industry or services).

The scenario takes as starting point that growth will gradually accelerate to 8 percent by 2013—broadly in line with the Government’s medium term targets. It then asks, what are the requirements to the three underlying drivers of growth to achieve this target? It is clear that all factors—the input of labor, the level of investments, and the rate of overall productivity growth—would have to increase well beyond the levels of the past year. Specifically, the labor-force participation rate would have to gradually increase from its current level of around 49 percent, to 52-53 percent—equivalent to 500,000 jobs created in the next decade, over and above the number of jobs necessary to absorb the underlying population growth. In terms of capital accumulation, an increase in the ratio of investments-to-GDP from the current level of about 25 percent, to around 30 percent, would be required. Some of this increase may be financed by foreign direct investment (FDI), but it would also probably require an increase in national savings. Finally, TFP would have to increase to around 3 percent per annum—about 1 percentage point higher than its average level during the recent high-growth period from 2004-08, and well above its historical average since 1980


Related:
PREM Note 42: Measuring growth in total factor productivity

What use is sources-of-growth accounting?;
So here is a contest for economist (or wannabe economist) readers of this blog: can you come up with an interesting question to which a sources-of-growth decomposition is the answer?

Tuesday, May 18, 2010

How's Palau's economy doing?


IMF review's Palau's economy;

Directors supported the continued use of the U.S. dollar as legal tender, given Palau’s small size and administrative capacity. They observed that Palau has maintained its external competitiveness, but remains vulnerable to terms of trade shocks. Greater pass-through of global oil prices to contain debt accumulation in public utilities would therefore be desirable. Directors welcomed continued improvements in financial sector oversight, but urged caution in proceeding with the plans to launch a corporate and ship registry, which could pose new challenges in fighting money laundering given Palau’s current oversight capacity.

Directors noted that high-quality data are essential for policy formulation and surveillance. They looked forward to the adoption of the GDP numbers compiled with the help of the Pacific Financial Technical Assistance Center and to the increase in staffing levels at the Bureau of Budget and Planning.


Related:
Palau- data from WDI

Tuesday, May 4, 2010

Assorted on Greece

Europe and IMF Agree €110 Billion Financing Plan With Greece

Prime Minister’s speech
;
Our first concern was to regain credibility with our citizens. We have been honest from the very first moment with the Greek people.


Huge National Debts Could Push Euro Zone into Bankruptcy

When did Greek economic policy turn bad?

Key Links for the Greek Financing Package

Employment Cost Index- the most comprehensive measure of labor costs!


Employment Cost Index-
Compensation costs for civilian workers increased 0.6 percent, seasonally adjusted, for the 3-month period ending March 2010, the U.S. Bureau of Labor Statistics reported today. Wages and salaries (which make up about 70 percent of compensation costs) increased 0.4 percent while benefits (which make up the remaining 30 percent of compensation)--increased 1.1 percent


Table A. Major series of the Employment Cost Index (Percent change)
Table 6. Employment Cost Index for total compensation(1), for private industry workers, by bargaining status and census region and division


Related:
Public Sector Pay Outpaces Private Pay;
The chart shows that public and private sector pay rose in parallel from 2001 to 2004. Then the lines diverged. Since early 2005, public sector pay has risen by 5% in real terms. Meanwhile, private sector pay has been flat.

Saturday, May 1, 2010

Chart of the Day- G spot in the GDP


Stumbling and Mumbling has an interesting post;
There are three “headline” measures of government activity, which my chart shows.
One is the output of government services - health, defence, education etc - which shows up within the output measure of GDP.
Another is government consumption, which comes in the expenditure measure of GDP.
And a third is overall central government current spending, which is reported in table PSF3 of the public finances; in my chart, I’ve deflated this by the GDP deflator.
And here’s the queer thing. The correlation between annual changes in these three measures is low; no higher than 0.26 since 1984Q1.
How come? One reason is that central government spending includes debt interest and welfare payments, which the other two don’t.
Another reason is that government consumption includes spending on procurement which is excluded from output.


Related;
Public Service Output, Input and Productivity: Healthcare

Public Service Output, Input and Productivity: Education

Thoughts for your reflection- Cities and Economic Growth

All throughout history, we’ve thought of heaven as the city on a hill. Done right, a city can be the pinnacle of human civilization. They’re the cathedrals of our era,”- Paul Romer

Related:
Global Prosperity Wonkcast;
“…just because something is unfamiliar that doesn’t mean it’s inconceivable or it can’t happen…[T]hink more broadly [about] challenges that look intractable — poverty, the environment, green globalization, an urbanization wave of 3 billion people. If we open up our notion of what’s possible then these intractable problems look like real opportunities that could reshape the globe and change history.”


Romer on Charter Cities


Paul Romer’s Bold New Idea for Charter Cities

Why Humanity Loves, and Needs, Cities;
The figure shows the 25 percent correlation between the logarithms of population density and 2008 gross metropolitan product per capita (using 2000 Census population numbers). Per capita productivity increases by 4 percent as population density rises by 50 percent.
But why does productivity rise with density?


A Tale of Many Cities

Cities Do It Better